Technical Analysis
View FREE Lessons!
Definition of Technical Analysis:
Technical analysis is an evaluation method using past prices, volumes, and the interpretation of charts and graphs to identify trends to predict a stock’s future price.
Detailed Explanation:
Technical analysis tries to predict the future by looking at the past. These analysts believe that changes in the volume traded and pricing patterns point toward the future interests of buyers (demand) and sellers (supply).
For example, analysts look closely at the relationship between a change in the number of shares traded (volume) and the change in the price. An increase in the trading volume of a stock indicates an increase in interest in that company. The key is interpreting that interest. Has the volume increased because investors want to buy, or has it increased because more shareholders want to sell? This would be easy to monitor if trading was still done on the floor of an exchange, where it would be easy to determine if there were more buyers than sellers. It is more difficult to see when most trading occurs electronically. The interest can be determined by the direction of the stock’s price. When volume is high while a stock’s price is rising, buyers are bidding up the price of the stock. The stock will probably continue to rise.
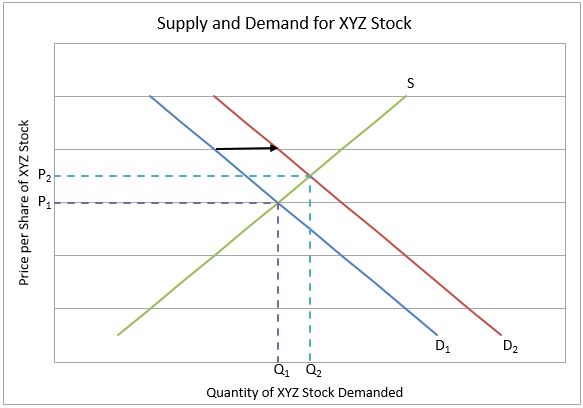
The graph below illustrates increased trading volume for XYZ, Inc. Assume promising news sparks a growing interest in the stock. The demand curve shifts from D
1 to D
2, resulting in an increase in the price (from P
1 to P
2) and an increase in the volume traded from Q
1 to Q
2. Heavy volume and rising market prices are common in a bull market when the demand for most stocks is increasing.

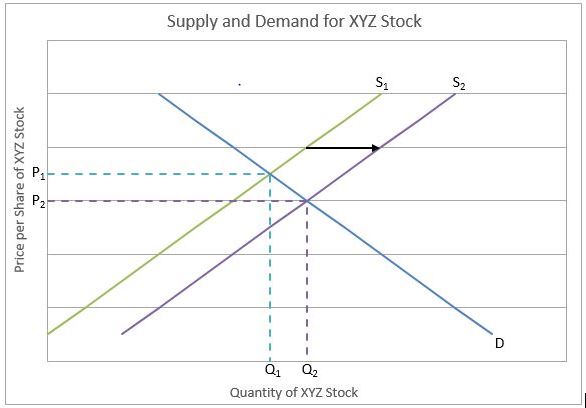
When volume is heavy and the stock price is falling, investors are interested in selling, so the stock’s price is more likely to continue falling. Assume XYZ, Inc. fails to achieve the expected earnings, and many shareholders choose to sell. The graph below illustrates how the resulting increase in supply from S
1 to S
2 pushes the price lower (P
1 to P
2) while increasing the volume traded (Q
1 to Q
2).

Heavy volume and falling prices are indicative of a bear market when the selling spirit is prevalent among investors. Monitoring the volume can help determine when a stock may change direction. For example, if the stock price is rising but volume is dropping, overall interest is waning, so fewer investors would probably be interested in purchasing the stock at the higher prices. The stock’s rise might subside or even reverse and begin to fall.
A stock’s supply and demand constantly fluctuate. When bad news results in more trade activity and an increasing supply of available stock, the demand may be decreasing. Pressure is created when investors want to rid themselves of a stock and are willing to offer the buyers a lower price to do so. Declining demands amplify the pressure on falling prices because the increase in supply and the decrease in the demand both lead to a lower quantity demanded.
Dig Deeper With These Free Lessons:
Understand a Stock’s Performance Using Supply and Demand
Capital – Financing Business Growth

