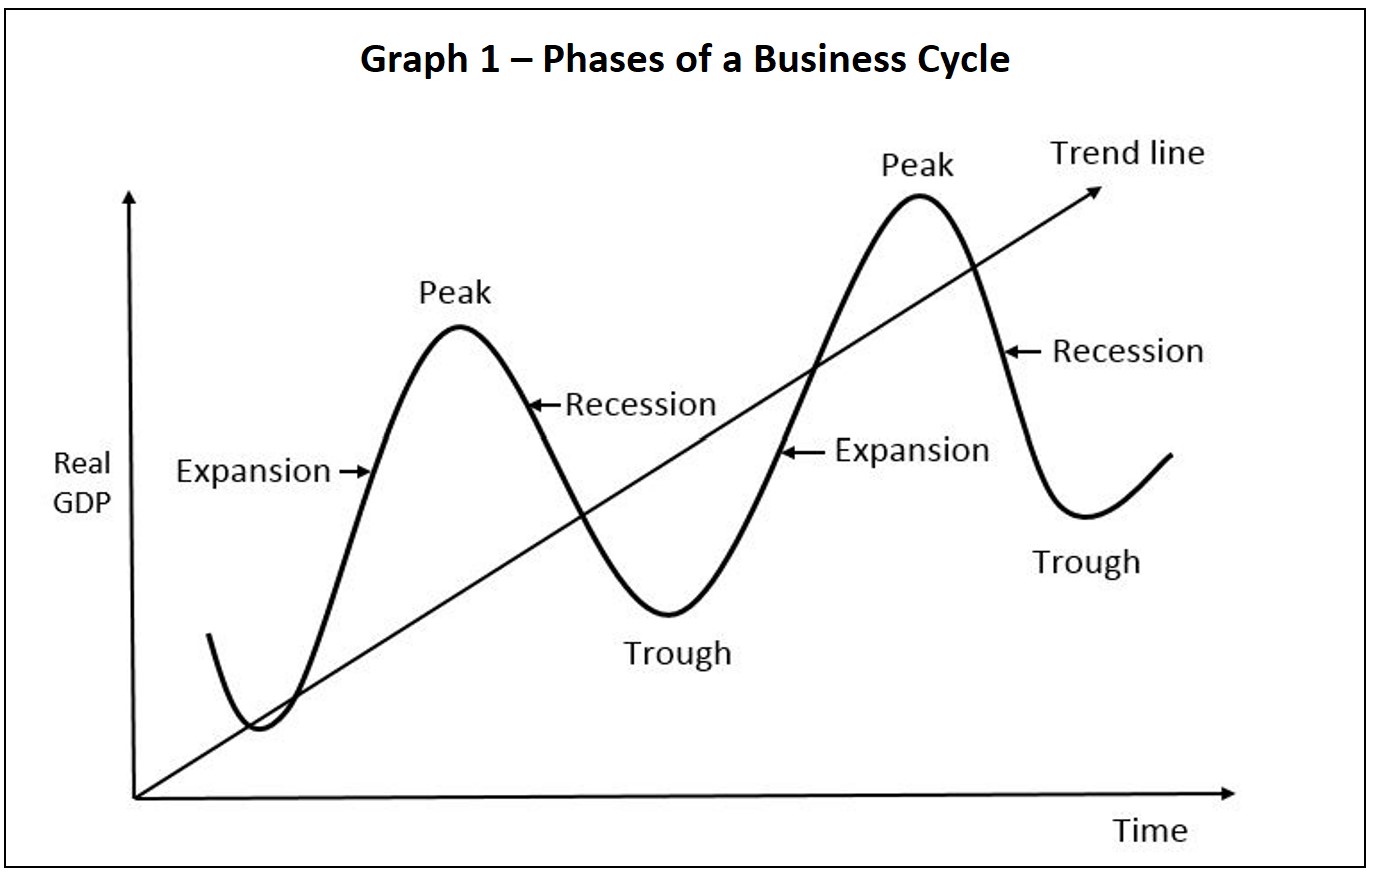
A growth trend line appears on a business cycle graph and shows the overall growth trend of economic activity over time.
Economies grow as they develop their resources and increase the production of goods and services, referred to as their real gross domestic product (RGDP). RGDP equals the value of final goods and services produced in an economy after adjusting for inflation over a defined period.
Economies move in business cycles. Graph 1 shows the phases of a business cycle. When graphing a business cycle, time is on the horizontal axis, and RGDP is on the vertical axis. The growth trend line in Graph 1 shows the overall trend of increasing economic activity over time. Advances in technology, a better-educated population, growth in the labor force, and entrepreneurial innovation are essential for increasing a country’s long-term growth potential.

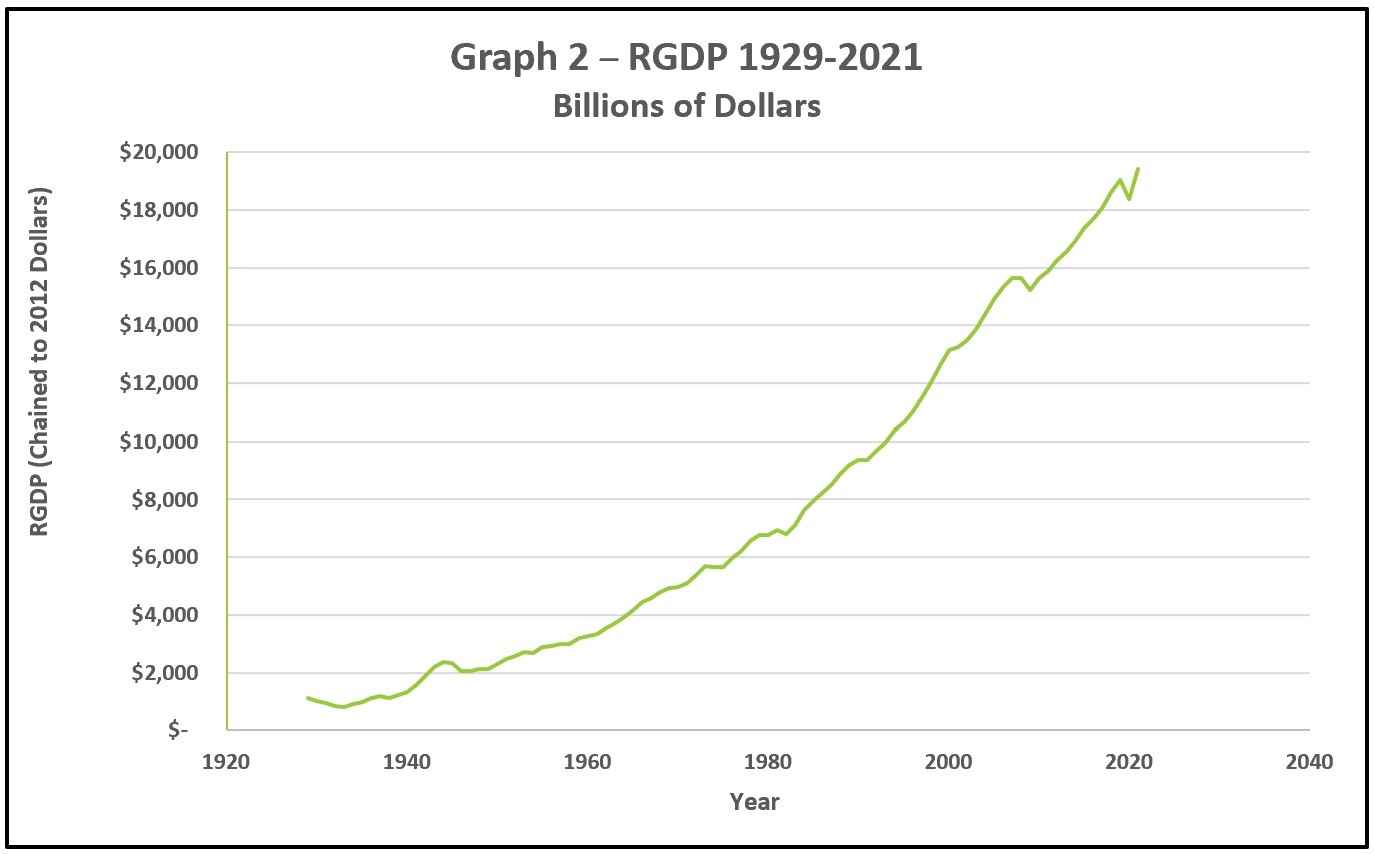
Graph 2 illustrates the growth in the US economy since 1929. Fortunately, the US economy has experienced tremendous stability and consistent growth over the long run. The dips in RGDP (recessions) are modest compared to the increase in RGDP (expansions). The average recession has lasted just under a year since 1945. Few countries have been as fortunate. The World Bank national accounts data reveal that in the US, the gross domestic product growth rate has ranged from 1.6 percent to 3.1 percent between 2011 and 2019 before contracting by 3.4 percent in 2020.
 Source: BEA Table 1.1.6 Real Gross Domestic Product Chained Dollars
Visit the World Bank to view the growth trend of other countries.
Comparative Advantage and Specialization
Gross Domestic Product – Measuring an Economy’s Performance