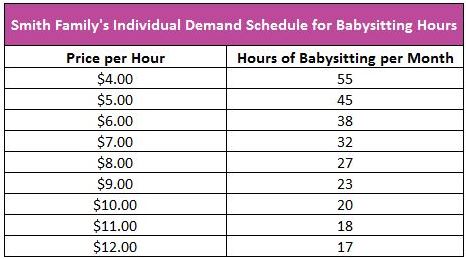
A demand schedule is a table showing the quantity demanded of a good or service at different prices over a specified period of time.
The law of demand states that all else being equal, the price of a good or service and the quantity demanded are inversely related: as the price increases, the quantity demanded decreases, and vice versa. However, the law of demand does not indicate how much the quantity demanded will change in response to a change in price. A demand schedule answers this question by showing the exact amounts of a good or service that will be purchased at different price levels.
For example, Mr. and Mrs. Smith have a seven-year-old daughter and enjoy going to the theater for “date nights.” On these nights, they hire Jane to babysit. The table below represents Mr. and Mrs. Smith’s demand schedule for babysitting, listing the number of hours they are willing to hire Jane at different hourly rates. At $4 per hour, they would hire Jane for 55 hours per month, but at $12 per hour, they reduce this to just 17 hours per month.
The Smith family represents one buyer, so their demand schedule is an individual demand schedule. Individual demand refers to the quantity of a good or service a single buyer is willing to purchase, given their limited income and the prevailing set of relative prices.

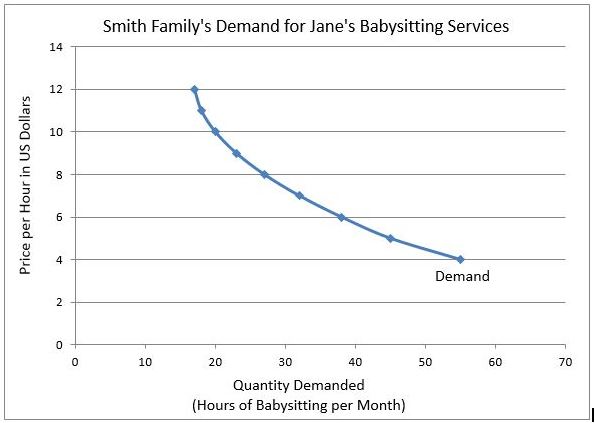
A demand schedule is used to plot a demand curve. Economists put the price on the vertical axis and the quantity demanded on the horizontal axis. The Smith’s demand schedule for babysitting has been used to plot their demand curve below.

Create your own individual demand schedule to understand your buying behavior. For example, consider how many soft drinks you would purchase in a month if the price were $0.25 per can. Now, how many would you buy if the price were $1.25 per can? To create your demand schedule for any good or service, make a table listing the quantities you would purchase at various prices.
You can then graph your demand curve by plotting the data points, with the price on the vertical axis and the quantity demanded on the horizontal axis.
Demand – The Consumer’s Perspective
Supply and Demand – Producers and Consumers Reach Agreement
Changes in Demand – When Consumer Tastes Change
Price Elasticity of Demand – How Consumers Respond to Price Changes