The US economy remains healthy. It continues to grow close to 3%. Inflation remains low and more people are returning to work at slightly higher wages. As expected, the Fed raised the fed funds rate from 1.5 to 1.75% at its March 21st meeting. Furthermore, Fed officials suggested this is just the beginning and they anticipate increasing rates several more times in 2018 and into 2019. This signals the Fed’s belief that the economy has gained enough strength that inflation is becoming a greater concern.
Stock prices were volatile in March. The daily spread between the low and high of the Dow Jones Industrial Average exceeded 400 points. Why the increase in volatility? The market is struggling to figure out the economy’s direction. Stock prices are driven by future expected earnings. Lower tax rates, a less restrictive regulatory environment, and international growth will help earnings. However, the threat of a trade war fueled by tariffs threaten earnings by increasing costs and restricting exports. Tariffs increase prices consumers pay. Inflationary pressures will probably result in further increases in interest rates as the FOMC uses contractionary policies. (Next week we plan to publish a blog on how the present volatility compares to historical trends, and what it means to an investor.)
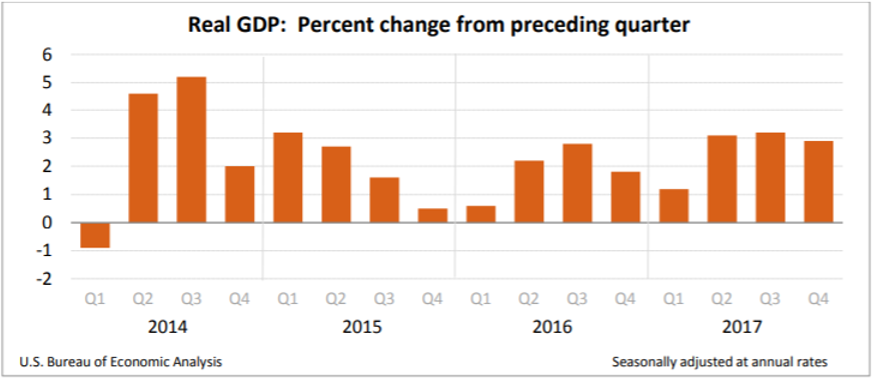
Real Gross Domestic Product (RGDP)
The US economy grew 2.3 percent in 2017, up from 1.5 percent in 2016 according to the third estimate of the
Bureau of Economic Analysis that was published last week. This is below President Trump’s goal of 3.0%, but remains above 2.0%, which is more typical this late in a business cycle. During the fourth quarter the growth in the real gross domestic product (
RGDP) was 2.9%, down from 3.2% in the third quarter and 3.1% in the second quarter. The driving forces were increases in personal consumption expenditures (
PCE), nonresidential fixed investments, and exports. PCE expenditures increased from 2.2 to 4 percent between the 3rd and 4th quarters. Many consumers replaced durable goods following the devastation of the hurricanes in late 2017 pushing the purchase of
durable goods up 13.7%.
The report provided the BEA’s initial estimate of fourth quarter corporate profits. During the quarter profits decreased $1.1 billion. This is down from a $90.2 billion increase in the third quarter. I do not believe these are indicative of any trend. Companies are taking advantage of the lower tax rates in 2018 by funneling more of its losses into 2017. (Read the full report at
BEA RGDP 2017 – 3rd Estimate.)
Visit our free lesson,
Gross Domestic Product – Measuring an Economy’s Performance, if you would like to learn more about the GDP.
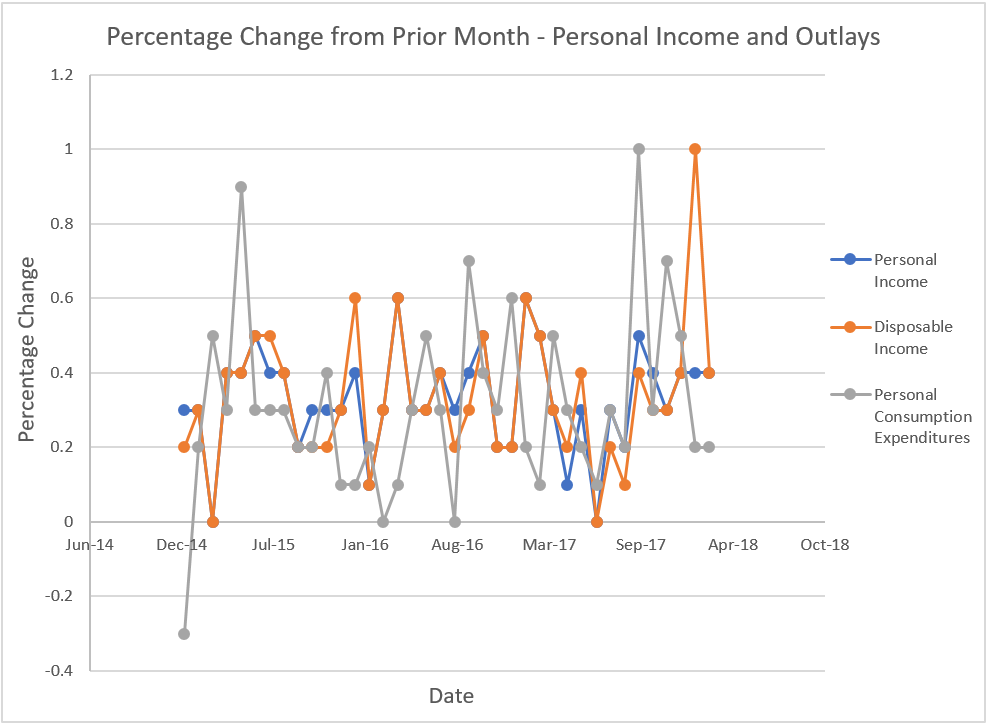
Personal Income and Outlays
Consumers earned and saved more in February according to the BEA’s
Personal Income and Outlays report that was released last week. Personal income increased 67.3 billion or 0.4%. More importantly, disposable income, also increased 0.4%.
Disposable income is the amount of money a household has available after paying personal taxes, which is used for consumer spending and saving. Households took advantage of the increase in disposable income by saving more. The savings rate rose to 3.4%, which is up from 3.2% in January and 2.5% in February. This is the second month in a row that spending has been less than most economists expected. They had expected consumers to spend more of their tax savings resulting from the Tax Cuts and Jobs Act approved in late December 2017. January’s growth in disposable income reflected the new tax law when it took a large 1% jump. It is interesting that the increase in disposable income since the tax cut has not resulted in a larger jump in consumer spending (PCE). In fact, it has slowed since the beginning of the year. November and December’s increases were 0.7% and 0.5%, respectively. January and February had 0.2% increases. (As mentioned elsewhere, the large increases at the end of 2017 is partially explained by the added durable good purchases following the hurricanes.) A constant increase in consumer spending or (PCE) is needed to sustain economic growth because consumer spending accounts for over 66% of economic activity.
Inflation continues to increase but remains below the Federal Reserve’s target of 2%. The
PCE price index increased 0.2% in February, which is half of January’s figure when energy prices rose dramatically. For the past twelve months prices are up 1.8%, up 0.1% from January. The
core price index, which excludes food and energy, equaled 1.6% for the prior twelve months and 0.2% for the month. The PCE price index is favored by the Federal Reserve, making it more important than the more commonly used consumer price index when evaluating
monetary policy.
Most contracts that are tied to inflation use the
consumer price index. Unlike the consumer price index, the PCE price index accounts for changes in spending behavior as the price of a good increases or decreases. For example, the weight given to chicken would increase if consumers substitute chicken for beef following an increase in the price of beef. The consumer price index compares items in a “basket” of commonly used goods and services. The measure assumes no change in the basket contents.
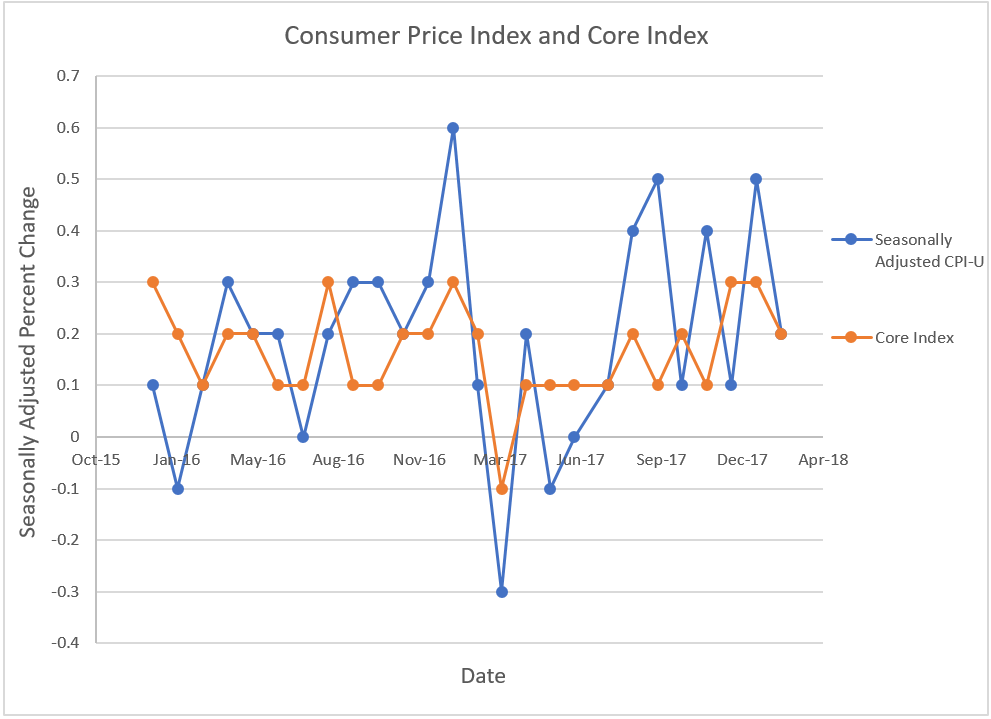
Consumer Price Index
February’s figures indicate that last month’s concerns of inflation may be premature.
Disinflation, or the lessening of inflation, occurred in January. All the major measures of changes in the price level increased in February, but at a slower pace than the past few months. The
Bureau of Labor Statistics reported that the consumer price index (CPI), core price index, and the
producer price index (PPI) all increased 0.2% in February. January’s CPI equaled 0.5%. A decline in gasoline prices was the primary contributor to the lower February rate. Gas prices increased 5.7% in January and fell 0.9% in February. Prices have increased 2.2% over the past 12 months. This is down from 2.7% in January. Most economists favor the core index because it excludes the food and energy prices. It was down from 0.3% in January. Over the past 12 months the core index has increased 1.8%.
The PPI measures inflation for suppliers. It is the weighted average cost of a basket of goods and services sold in the wholesale, manufacturing, and commodity markets. The PPI is a leading indicator and frequently signals future changes in the CPI. Businesses may try to pass some of their cost increases (which is measured in the PPI) through to the final buyer (which is measured in the CPI). The index dropped from 0.4% in January to 0.2% in February, however, the year to date measured 2.7%, the highest since 2014! This is the largest increase since August. Visit
BLS – Producer Price Index for the most recent report.
It is true, February’s figures lower the concern about inflation – but I remain convinced that inflation will continue to escalate in 2018. What could spark inflation? The labor market will continue to tighten, and wages should continue to rise. Consumer spending will continue to increase as incomes rise, which will increase
aggregate demand. A weaker dollar will continue to increase commodity prices. (This is one reason the PPI for the last 12 months has increased.) A trade war, and the added cost of tariffs will be passed through to consumers as higher prices. (See blog –
President Trump’s Proposed Tariff – The Economics.
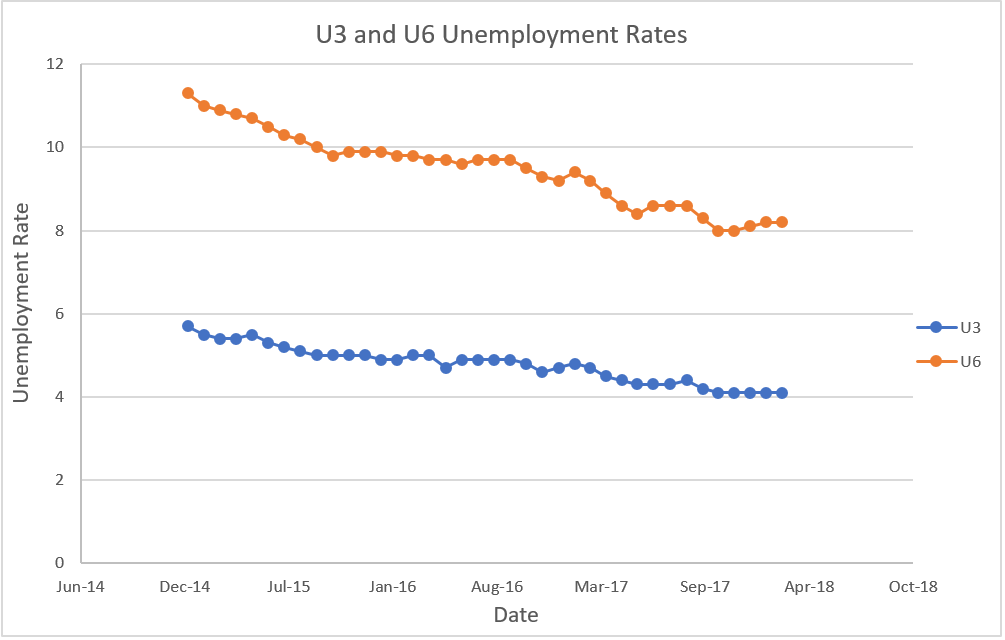
Employment
Americans are returning to work in record numbers! The Bureau of Labor Statistics reported that the unemployment rate remained at 4.1% for the fifth consecutive month. However, 313,000 people were added to non-farm payrolls. This is the largest gain since July 2016. The construction and retail trade categories benefited the most.
Why is the unemployment rate unchanged while a record number of people are added to payrolls? Because more people who were on the side-lines are returning to work. The unemployment rate only includes individuals who have actively searched for employment during the prior four weeks. The participation rate increased to 63%, its highest level since September 2017. It is the percentage of the total working population who are either employed or seeking employment. People who had been discouraged now believe they can find a job and are re-entering the work force. But the participation rate remains lower than rates prior to the Great Recession. For example, between 1997 and 2000 the participation rate exceeded 67%. Surprisingly, another measure of employment, the U6 rate remained unchanged at 8.2%. This rate includes people who are discouraged. They may give up a job search or accept part-time work when they want to work full-time. It also includes the underemployed, people who accept jobs below their skill level. (For a discussion of the different types of unemployment read our blog:
Healthy and Unhealthy Unemployment – Who is Included).
The historically low participation rate and the stubborn U6 rate mean that there is much room to add people to the full-time work force. Many economists believe this explains last year’s less than expected appreciation of wages. In February, the average workweek for all employees on non-farm private payrolls increased 0.1 hour to 34.5 hours per week. Hourly wages increased $0.04 to $26.75. This follows a 7-cent increase in January. In the preceding 12 months, wages have increased 2.6%, or $.68.
Read the Bureau of Labor Statistics
Employment Situation Summary.